We have seen eight participants:
You can download all alignments delivered by participants. They are in one directory conference10 named as it follows: matcher-ontology1-ontology2.rdf.
Please let us know what kind of an experiment you do with those data and the reference alignment (ondrej.zamazal at vse dot cz).
This year we considered results of participants with the following evaluation methods:
We have 21 reference alignments, which corresponds to the complete alignment space between 7 ontologies from the data set. You can download this reference-alignment. Please let us know how you use this reference-alignment and data set (ondrej.zamazal at vse dot cz).
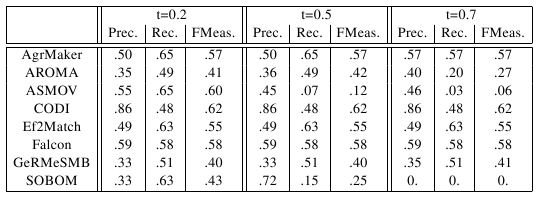
In the table below, there are results of all eight participants
with regard to the reference alignment. There are traditional precision
(P), recall (R), and F-measure (F-meas) computed for three different
thresholds (0.2, 0.5, and 0.7). We use F-measure, which is the harmonic
mean of precision and recall.

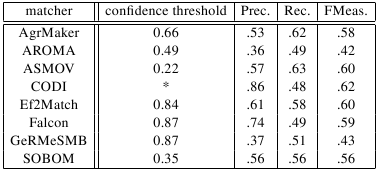
For better comparison we found an optimal threshold in terms of
highest average F-measure, see Table below. A dependency of F-measure
on a threshold can be seen from the Figure below In the table there
are precision, recall, and F-measure for an optimal threshold. There is
one 'asterisk' in the column of threshold for matchers which did
not provide graded confidence values.
The matcher with the highest average F-measure (62%) is the CODI which did not provide graded confidence values. Other matchers are very close to this score (ASMOV 60%, Ef2Match 60%, Falcon 59%). However we should take into account that this evaluation has been made over small part of all alignments (one fifth).


We can also compare performance of participants wrt. last two years (2008, 2009). There are three matchers which also participated in last two years. ASMOV participated in all three consecutive years with increasing highest average F-measure: from 43% in 2008 and 47% in 2009 to 60% in 2010. AgreementMaker participated with 57% in 2009 and 58% in 2010 regarding highest average F-measure. Finally, AROMA participated with the same highest average F-measure in both years, 2009 and 2010.
This year we have not received any alignments with subsumption relations, therefore we did not compute `restricted semantic precision and recall'.
This year we take the most secure, i.e., with highest confidence, correct correspondences as a population for each matcher. Particularly, we evaluate 100 correspondences per matcher randomly chosen from all correspondences of all 120 alignments with confidence 1.0 (sampling). Because AROMA, ASMOV, Falcon, GeRMeSMB and SOBOM do not have enough correspondences with 1.0 confidence we take 100 correspondences with highest confidence. For all of these matchers (except ASMOV where we found exactly 100 correspondences with highest confidence values) we sampled over their population. In table below you can see approximated precisions for each matcher over its population of best correspondences. N is a population of all the best correspondences for one matcher. n is a number of randomly chosen correspondences so it is 100 best correspondences for each matcher. TP is a number of correct correspondences from the sample, and P* is an approximation of precision for the correspondences in each population; additionally there is a margin of error computed as: sqrt((N/n)-1)/sqrt(N) based on [4].

Data Mining technique enables us to discover non-trivial findings about systems of participants. These findings can answer analytic questions, such as:
We formulated abovementioned and similar analytic questions as tasks for mining association rules using the LISp-Miner tool and its 4ft-Miner procedure. In those tasks we also employed matching patterns [2] and correspondence patterns [1].
This kind of evaluation was first tried two years ago [2]. We furthermore extended this approach and applied on data from years 2006, 2007 and 2008 [5].Here are the full descriptions and results of four tasks output by LISp-Miner tool:
Results are briefly described in [6].
This method has been done by Christian Meilicke and Heiner Stuckenschmidt from Computer Science Institure at University Mannheim, Germany.
Results are available in [6].
Contact addresses are Ondřej Šváb-Zamazal (ondrej.zamazal at vse dot cz) and Vojtěch Svátek (svatek at vse dot cz).
[1] Scharffe F., Euzenat J., Ding Y., Fensel,D. Correspondence patterns for ontology mediation. OM-2007 at ISWC-2007.
[2] Šváb O., Svátek V., Stuckenschmidt H.: A Study in Empirical and 'Casuistic' Analysis of Ontology Mapping Results. ESWC-2007. Abstract Draft paper (final version available via SpringerLink)
[3] Meilicke C., Stuckenschmidt H. Incoherence as a basis for measuring the quality of ontology mappings. OM-2008 at ISWC 2008.
[4] van Hage W.R., Isaac A., Aleksovski Z. Sample evaluation of ontology matching systems. EON-2007, Busan, Korea, 2007.
[5] Šváb-Zamazal O., Svátek V. Empirical Knowledge Discovery over Ontology Matching Results. IRMLeS 2009 at ESWC-2009.
[6] Euzenat J. et al.: Results of the Ontology Alignment Evaluation Initiative 2010.