We have seen seven participants:
You can download all alignments delivered by participants. They are in one directory conference09 named as it follows: matcher-ontology1-ontology2.rdf.
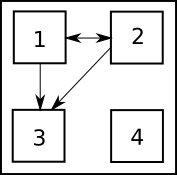
Evaluation methods are strongly intertwined. Mutual interdependencies are schematically depicted in Figure 1.
All but one methods are a posteriori evalution methods.
This year we consider to evaluate results of participants with following evaluation methods:
This year, we extended the reference alignment from the previous year. Now we have 21 alignments, which corresponds to the complete alignment space between 7 ontologies from the data set. You can download this reference-alignment. Please let us know how you use this reference-alignment and data set (ondrej.zamazal at vse dot cz).
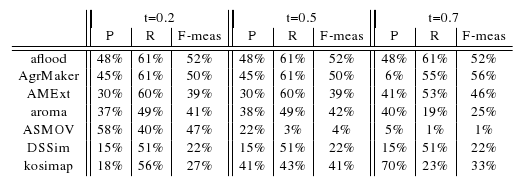
In the table below, there are results of all seven participants
with regard to the reference alignment. There are traditional precision
(P), recall (R), and F-measure (F-meas) computed for three different
thresholds (0.2, 0.5, and 0.7). We use F-measure, which is the harmonic
mean of precision and recall.

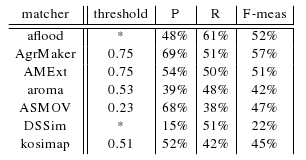
For better comparison we found an optimal threshold in terms of
highest average F-measure, see Table below. A dependency of F-measure
on a threshold can be seen from the Figure below. In the table there
are precision, recall, and F-measure for an optimal threshold. There
are two 'asterisks' in the column of threshold for matchers which did
not provide graded confidence values. The matcher with the highest
average F-measure (57%) is the AgreementMaker (AgrMaker) at 0.75
threshold. However we should take into account that this evaluation has
been made over small part of all alignments (one fifth).


We
also evaluated the results of participants of OAEI-08 (ASMOV, DSSim and
Lily) against reference-alignment. From Table below, we can see
precision, recall, and F-measure for three different thresholds:

For these three matchers from OAEI-08, we found an optimal threshold in terms of highest average F-measure, see Table below. In the case of DSSim there is an asterisk because this matcher did not provide graded confidence values. The matcher with the highest average F-measure (0.49) was the DSSim. However we should take into account that this evaluation has been made over small part of all alignments (one fifth). We can also compare performance of participants of both years ASMOV and DSSim. While in terms of highest average F-measure ASMOV improved from 43% to 47%, DSSim declined from 49% to 22%. We can also see that ASMOV matcher from OAEI-09 delivered more correspondences with lower confidence values than in OAEI-08.

ASMOV and DSSim teams delivered not only equivalent relations but also subsumption relations. In this evaluation we considered merely equivalent relations.
In another evaluation we also took into account correspondences with subsumption relations. We computed restricted semantic precision and recall
[5] using tool from University of Mannheim. We only took into account
matchers which also delivered correspondences with subsumption
relations, ie. ASMOV and DSSim. In Table below there are two different
semantics variants (natural and pragmatic) of restricted semantic
precision and recall computed for threshold 0.23 which is an optimal
threshold in terms of highest F-measure for ASMOV. DSSim has just
certain correspondences.

We can see from Table that considering correspondences with subsumption relations ASMOV matcher has better performance in both precision and recall, whereas DSSim matcher has much better recall at expense of big decline of precision.
New reference alignment will be published at the time of the Ontology Matching workshop 2009.
The number of all distinct correspondences is always quite high number, therefore we will take advantage of sampling. This year we will just take the most probable correct correspondences as a population for each matcher. It means we will evaluate 150 correspondences per matcher randomly chosen from all correspondences of all 105 alignments with confidence value 1.0. Because aroma, ASMOV and kosimap do not have enough correspondences with 1.0 confidence measures we take 150 correspondences with highest confidence measures. In the case of aroma there was no possible to distignuish between all 153 correspondences so we did sample over its population.
In table below you can see approximated precisions for each matcher over its population of best correspondences. N is a population of all the best correspondences for one matcher. n is a number of randomly chosen correspondences so as to have 150 best correspondences for each matcher. TP is a number of correct correspondences from sample, and P* is an approximation of precision for the correspondences in each population; additionally there is a margin of error computed as sqrt((N/n)-1)/sqrt(N). From Table below we can conclude that kosimap has the best precision (96%) over its first 150 correspondences wrt. confidence values. Further matchers are in this order: ASMOV, AgreementMaker, AgreementMakerExt, aroma, aflood, and DSSim.

Data Mining technique enables us to discover non-trivial findings about systems of participants. These findings try to answer so-called analytic questions, such as:
We tried to answer abovementioned and similar analytic question. Those analytic questions deal with so-called mapping patterns [2] and newly also with correspondence patterns [1].
For the purpose of this kind of evaluation, we use the LISp-Miner tool. Particularly, we use the 4ft-Miner procedure that mines association rules. This kind of evaluation was first tried two years ago [2].
Report from this evaluation is only in the paper [7].
In 2008 we evaluated for the first time the coherence of the submitted alignments. Again, we picked up the same evaluation approach using the maximum cardinality proposed in [3]. This measure compares the number of correspondences that have to be removed to arrive at a coherent subset against the number of all correspondences in the alignment. The resulting number can be considered as the degree of alignment incoherence. A number of 0% means, for example, that the alignment is coherent. In particular, we use the pragmatic alignment semantic as defined in [6] to interpret the correspondences of an alignment.
| Matcher | Correspondences | Incoherent Alignments | Max. Cardinality Measure |
|---|---|---|---|
| ASMOV0.23 | 140 | 0 | 0.0% |
| ASMOV | 233 | 3 | 1.8% |
| kosimap0.51 | 189 | 6 | 10.6% |
| ASMOVx | 316 | 13 | 14.7% |
| AgrMaker0.75 | 173 | 12 | 15.0% |
| aflood* | 288 | 15 | 19.8% |
| AROMA0.53 | 264 | 13 | 20.1% |
| AMExt0.75 | 236 | 13 | 20.3% |
| DSSim* | 789 | 15 | >42.2% |
In our experiments we focused on equivalence correspondences and removed subsumption correspondences from the submitted alignments prior to our evaluation. We applied our evaluation approach to the subset of those matching tasks where a reference alignment is available. We used the Pellet reasoner to perform our experiments and excluded the Iasted ontology, which caused reasoning problems in combination with some of the other ontologies.
Results are presented in the table on the right. For all systems we used the alignments after applying the optimal confidence threshold (see subscript), and the systems marked with * are those systems that did not deliver a graded confidence. Comparing the corresponding results, the ASMOV system clearly distances itself from the remaining participants. All of the generated alignments were coherent and thus we measured 0% degree of incoherence. However, the thresholded ASMOV alignments contain only few correspondences compared to the alignments of the other systems, which makes it more probable to construct coherent alignments. Thus, we also included the untresholded ASMOV alignments (no subscript) in our analysis: We measured a degree of incoherence of 1.8%, a value that is still significantly lower compared to the other systems.
While the verification component built into ASMOV detects most incoherences, none of the other systems uses similar strategies. We have to conclude that logical aspects play only a subordinate role within the approaches implemented in the other matching systems. Additionally, we analyzed what happens when the verification component of ASMOV is turned off (We would like to thank Yves R. Jean-Mary for providing us with the corresponding set of alignments.). The results are presented in the ASMOVx row. Notice that the measured values are now similar to the coherence characteristics of the other systems.
Contact addresses are Ondřej Šváb-Zamazal (ondrej.zamazal at vse dot cz) and Vojtěch Svátek (svatek at vse dot cz).
[1] Scharffe F., Euzenat J., Ding Y., Fensel,D. Correspondence patterns for ontology mediation. OM-2007 at ISWC-2007.
[2] Šváb O., Svátek V., Stuckenschmidt H.: A Study in Empirical and ‘Casuistic’ Analysis of Ontology Mapping Results. ESWC-2007. Abstract Draft paper (final version available via SpringerLink)
[3] Meilicke C., Stuckenschmidt H. Incoherence as a basis for measuring the quality of ontology mappings. OM-2008 at ISWC 2008.
[4] van Hage W.R., Isaac A., Aleksovski Z. Sample evaluation of ontology matching systems. EON-2007, Busan, Korea, 2007.
[5] Fleischhacker D., Stuckenschmidt H.: Implementing semantic precision and recall. accepted for poster session at OM-2009 at ISWC 2009.
[6] Meilicke C., Stuckenschmidt H.. An Efficient Method for Computing a Local Optimal Alignment Diagnosis. Technical Report, University Mannheim, 2009.
[7] Euzenat J. et al.: Results of the Ontology Alignment Evaluation Initiative 2009.